- Grimport Language Documentation
- Installation of Grimport & Other Software
- Variables & Syntax
- Control Structures
- Extract data from a page
- Export Filtered Data
- Programming with Grimport Script Editor
- Crawler and Logs
- GRS, GRC & GRL
- Folder Organization
- Launch Options
- Cache
- Mistakes & Errors
- Connected services
- To Go Further
Programming with Grimport Script Editor
In this part we will see how to use the Grimport Script Editor IDE, from writing the script to running it.
Introducing Grimport Script Editor
Graphical interface of Grimport Script Editor :
CLICK TO ZOOM
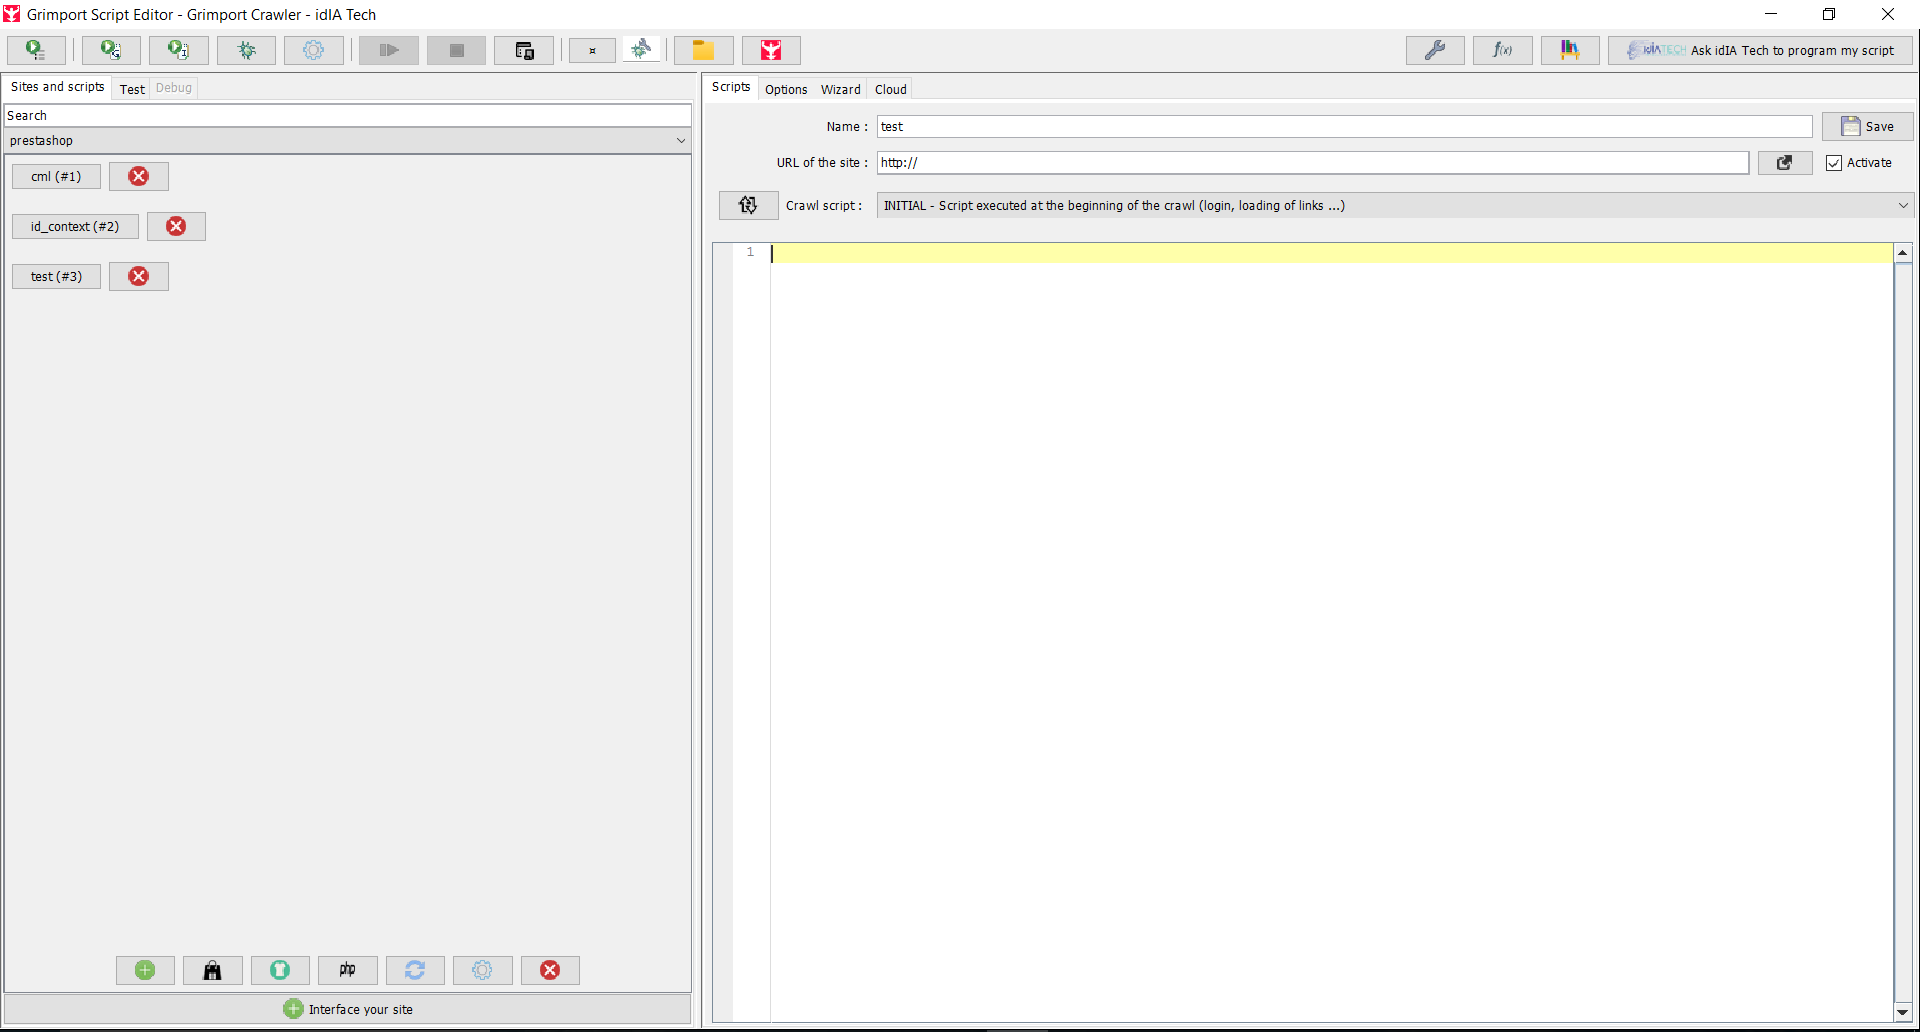
This interface is divided into 3 parts:
- An action bar at the top
- On the left side, you can select the script
- On the right, you manage the script being edited.
The different features:
Top of the page:
-

The first button at the top left is used to launch all the scripts of a site one after the other. -

The second button at the top left only runs the script that is open. -

The third button allows to launch the selected text as a script. -

The fourth button allows to debug a script. If you use breakpoints, you must use them, otherwise they will not be taken into account. -

The fifth button allows you to access the launch options.
Left side of the page:
Sites and scripts allows you to manage scripts and interact with your site
Test is dedicated to tests and allows to check if the developed script works on a page. This tab also allows you to test CSS selectors or regular expressions to know if they are correct on the tested page.
Debug is dedicated to debugging and allows you to inspect variables when setting breakpoints.
Central part of the page:
The central part corresponds to the writing of the script and its options.
You then have 2 types of script that you can choose by clicking on this button:![]()
You can choose between :
- a simple script
- a crawling script wich includes:
- the INITIAL script (script executed at the beginning of the crawling)
- the FORPAGE script (script executed on each page)
- the FINAL script (script executed at the end of the crawling)
In the central part, there are 4 tabs: Scripts, Options, Wizard and Cloud:
(here we are only interested in the crawling script and not the simple script)
-
Scripts allows you to name your script, indicate the home page of the target site and write your script to be executed.
-
Options allows you to modify the behavior of the crawler. Here are the different options that can be defined:
- Regular expression for URLs to avoid: Here, it's a regular expression that allows to avoid going on all the URLs of the targeted site. For example, we have excluded all URLs containing the term "logout" to avoid logging out if you are connected to the site.
- HTTP-User-Agent: It is what identifies the browser and the computer you are on. It is a text that is sent in each http request. It allows to indicate the browser you are using to the website. There are 3 User Agents by default: the first one is for a classic browser, the second one is to identify yourself as a Googlebot to avoid filtering and the third one is to identify yourself as a smartphone. You can use your personnal user-agent too.
- Order in analys: It allows you to order the scripts (if there are several) so that one of them runs first.
- Deepness: It will define the limit of pages to open according to the depth. For example, the home page is depth 0, pages with a link on the home page are depth 1, etc. The FORPAGE script will be executed on each of these pages.
- Time between requests: It avoids flooding a website, i.e. not to send too many requests quickly in order to space out the requests. This is useful for servers with little power.
- Maximum number of URLs to visit: It allows to set a limit of URLs because sometimes crawling never stops.
- Cookie tracking mode:It allows to manage the cookie (do we let the page modify this cookie or do we prevent it).
- Make a progress backup every X urls visited: It allows to save the progress of the crawling every X urls visited. It avoids losing everything when there is an internet cut for example.
- Number of parallel crawling tasks: It allows to launch several crawlers in parallel and to speed up the script. Attention, if you use this option, your script must have been parallelized correctly.
-
Wizard allows you to modify elements of the script through a graphical interface that you set up.
-
Cloud allows to launch and manage the script on the Cloud.
Now that we have seen how Grimport Script Editor is structured, let's see how to use it.
Using Grimport Script Editor
Interface a site
The first thing to do when you are on Grimport Script Editor is to interface your site. To interface your site with the IDE, you will find a GRS file in our module configuration on your CMS. On Prestashop you will find it in Modules -> Module Manager -> Configure (next to Intelligent Catalog Importer and Manager) -> Interface this site on Grimport
You can interface your site in another way. Go to Grimport Script Editor and click on "Interface your site" at the bottom left. Then, give a name to your site and enter the communication link that is on the prestashop module. Once done, you can create a new script by naming it and saving it, indicate the homepage of the target site and choose your type of script (simple script or crawl script).
The script will then be created on prestashop. You will find it in Catalog -> Intelligent Importer -> Manage external catalogs. The scripts on this page are synchronised with the Grimport scripts.
Write a script
After interfacing your site with Grimport Script Editor, you can start writing your script clicking on ![]() . You will need to switch to "Developer" display mode by clicking on
. You will need to switch to "Developer" display mode by clicking on ![]() at the top right.
at the top right.
Hover over an already written function to display the documentation again.
To have the HTML documentation of the functions click on ![]() at the top right, you can do a quick search. If you select a function beforehand in the Script Editor, you will be redirected immediatly to the HTML documentation of the function.
at the top right, you can do a quick search. If you select a function beforehand in the Script Editor, you will be redirected immediatly to the HTML documentation of the function.
You can also access the PHP functions library on your CMS by clicking on ![]() .
.
You can also add functions by yourself in the PHP library.
Test and debug a script
Test a script
When you have finished writing your script, you will have to test it because in case of a bug, an error will be reproduced on all the data you want to extract.
Take one of the pages concerned by the extraction script, copy the URL and paste it in the Test tab below Test page. Then press ![]() to test the script on the page. Check that the console does not return an error message and that the extracted data conforms to your specifications.
to test the script on the page. Check that the console does not return an error message and that the extracted data conforms to your specifications.
You can test CSS selectors and regular expressions.
You can also run only a selected piece of code with the third button ![]() at the top left.
at the top left.
Debug a script
It is essential to debug a script when there are errors. You have then several features to debug a script:
-
This button launches the debugger. If you use breakpoints, it is mandatory to use this option or the breakpoints will be ignored.
-
 This icon allows to put a line breakpoint. You can set a line break by clicking in front of the line of code you want to stop on. This breakpoint is very useful because you can add it during debugging.
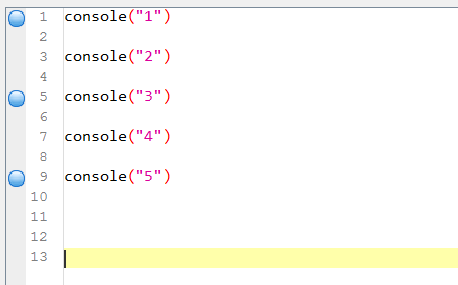
-
 This button allows you to choose the different options with which you can run the debugger:
- Desactivate the step-by-step mode
- Ignore line breakpoints
- Ignore text breakpoints
The step-by-step mode will stop on each line of code and you will have to press each time it stops on ![]() to continueFor example, you can stop at a breakpoint before a problematic area of code, then turn on step-by-step mode to inspect each line of code, and when you are done correcting, turn off step-by-step mode to use the breakpoints instead.
to continueFor example, you can stop at a breakpoint before a problematic area of code, then turn on step-by-step mode to inspect each line of code, and when you are done correcting, turn off step-by-step mode to use the breakpoints instead.
The problem with the step-by-step mode is that it is relatively tedious, especially if our code is quite long. To go faster, it will be better to put breakpoints where you want to stop and check the option "Desactivate the step-by-step mode". After the debugger has stopped at the breakpoint, you should click on the button ![]() to continue.
to continue.
During debugging, you can use Ctrl+Shift+I to evaluate the selected code and display it.
Next ❯ ❮ Previous